Before the Storm: The 2017 Downhill World Cup Season in Numbers
2017 has arguably been one of the most exciting downhill seasons in both the men's and women's fields. With the stakes are as high as ever coming into the final race of the season in Val di Sole, I thought it would be interesting to take a look back at the past six races, not analyzing each race in too much detail but rather unravel the drama unfolding. So I scraped the time sheets to see what would emerge. Whether you have followed the season closely or not, here is a chance to revisit or catch up. I will keep my comments to a minimum and let the graphics tell the story.
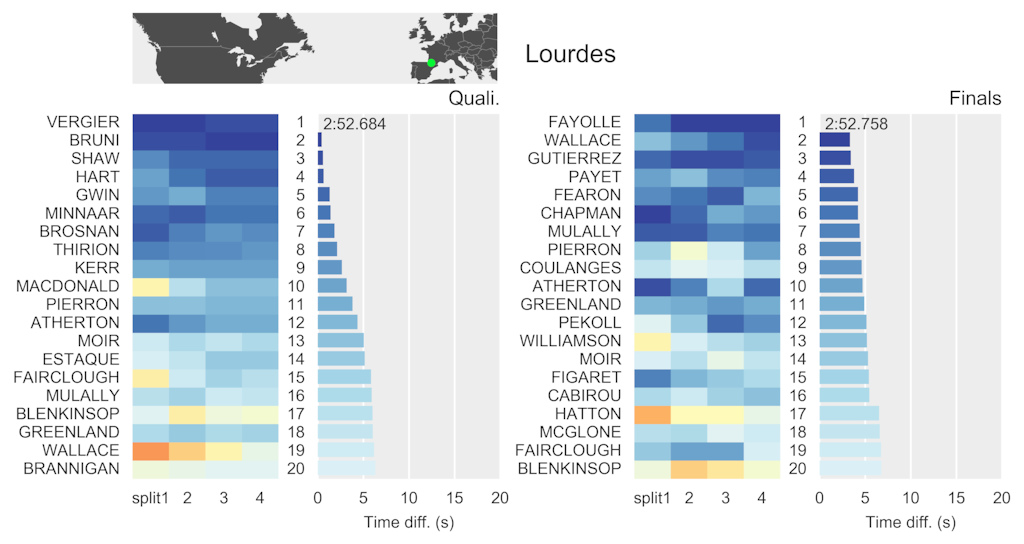
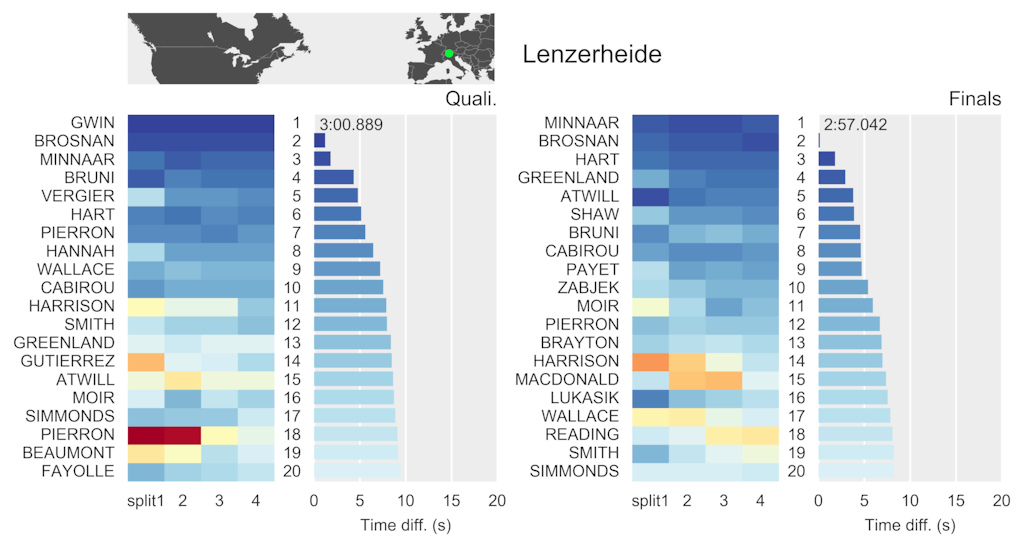
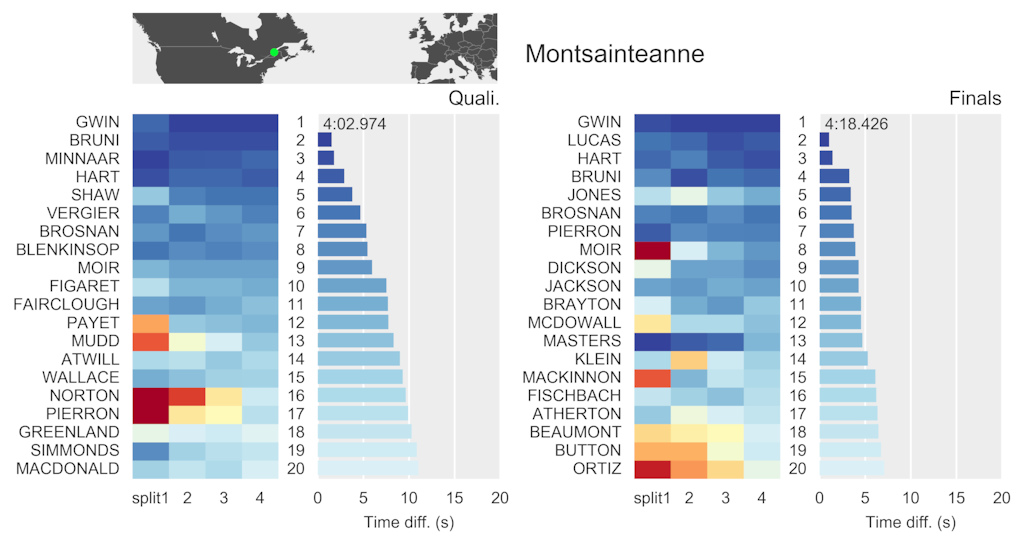
First, let’s briefly recapture the action of each race looking at both the qualification and the finals. There really is a lot of data involved and, for now, I will only be looking at the Elite Men category. In the first graphs, I have visualized the results of the top 20 finishers at each venue. The left panels are heat maps of the rankings as they proceed through the four split times. The first position is color coded dark blue, on the other end of the color scale, position 50 is dark red.
The actual position is not really discernible since what is emphasized here is the change of ranking, i.e. the change of color. Note how roughly the top 5 riders consistently stay on top (consistently blue shades). In the top 10–20, it looks like a bad Split 1 can still be compensated in the race. Riders like Jack Moir or Mark Wallace seem to need some time to get into the race as their position at split 1 is often much worse than their final position.
The right part of the panels show the time differences relative to the smoking time. The scales for all races are identical. Note big time differences of almost 20 seconds in the top 20 rankings for the long races such as Fort William while the time differences are below 10 seconds for short tracks like Lenzerheide. Surprising, however, is that for the second longest track, Mont-Sainte-Anne, the time differences of the top 20 are within seven seconds, less than for the much shorter track of Lenzerheide.
What is also interesting is the general convex shape of the bars in the vertical direction. The time differences do not increase with a constant, linear slope. The slope seems to be steeper for the top 5 racers than for the ranks 10 to 20. An exception to this observation is the first race in Lourdes which was slightly interfered by rain in the finals and threw off the strong contenders. Mont Sainte Anne shows quite a linear increase of time differences only after the top four riders. So it looks like the top five or so guys really have something special in the bag. But one would definitely need to examine a lot more races for a better statistics to substantially infer anything about the performance density at the top. However, this observation seems to be accounted for, since if you look at the points allocation system shown below, the riders at the top really are un proportionally rewarded with points for the overall ranking. The nonlinear gaps in awarded points reflect the typical gaps in race times.
![The 2017 Downhill World Cup Season in Numbers]()
Points Earned at Each Venue
So now, let’s look at the total points gained in each race by the top 20 riders. Shown here are bar charts of total points with separate contribution of qualification and finals distinguished by color.
![The 2017 Downhill World Cup Season in Numbers]()
![The 2017 Downhill World Cup Season in Numbers]()
![The 2017 Downhill World Cup Season in Numbers]()
![The 2017 Downhill World Cup Season in Numbers]()
![The 2017 Downhill World Cup Season in Numbers]()
![The 2017 Downhill World Cup Season in Numbers]()
Note that in general, there is quite a good correlation between qualification and total points. The vertical ordering of bars is by total points, and the qualification points also generally increase with the final score. Some exceptions to this general observation are riders like Vergier (in Fort William) or Gwin (Lenzerheide).
The rain in Lourdes is identified by the fact that not many qualification points have been taken from the top 10 finishers. On the other hand, in Mont-Sainte-Anne, only the top seven finishers had points from qualification as well.
Points Accumulated Throughout the Season
Next look at how these points accumulated over the season. The respective bar charts show the cumulative sums of total points and contribution from qualification and finals after each race.
Minnaar clenched the first place in the overall after Fort William and hold onto the lead. But in Mont Sainte Anne, the gap has been closing down to less than 100 points between the top three riders to keep things exciting for the last race.
Considering the total of 250 points on the table in the final race and the fact that anything is possible in downhill racing, anything is still possible for the top three.
![The 2017 Downhill World Cup Season in Numbers]()
![The 2017 Downhill World Cup Season in Numbers]()
![The 2017 Downhill World Cup Season in Numbers]()
![The 2017 Downhill World Cup Season in Numbers]()
![The 2017 Downhill World Cup Season in Numbers]()
![The 2017 Downhill World Cup Season in Numbers]()
Just looking at the separate contributions of qualifying and finals, see how Gwin, Minnaar, and Brosnan are all strong on both days of the race weekend. On the other hand, racers like Vergier or Shaw have been a little unlucky in the finals. The relative contribution of qualification points to their total is much higher than for example Moir, Wallace, Gutierrez or Lucas, who clinched more points come finals.
Finally, look at the season from each of the top 20 rider’s point of view.
![The 2017 Downhill World Cup Season in Numbers]()
There really is a consistency within the top 10. Guys like Hart, Bruni, and Lucas have been ramping it up slowly over the season. Wallace and Gutierrez, for example, have unfortunately been losing a bit of ground lately. Does this help anything towards a prediction for Val di Sole? Well, it’s downhill, so no prediction from past data, may the best racer of the day win on an equal track for everyone. In any case, the top three guys will have to battle it out and expect anyone from the top 20 to throw themselves into the mix.
Respect to all the racers, and bring it on once again this weekend!
MENTIONS: @axel-vertman
First, let’s briefly recapture the action of each race looking at both the qualification and the finals. There really is a lot of data involved and, for now, I will only be looking at the Elite Men category. In the first graphs, I have visualized the results of the top 20 finishers at each venue. The left panels are heat maps of the rankings as they proceed through the four split times. The first position is color coded dark blue, on the other end of the color scale, position 50 is dark red.
 |
 World Cup DH Round 1: Lourdes World Cup DH Round 1: Lourdes |
 |
| World Cup DH Round 2: Fort William |
 |
| World Cup DH Round 3: Leogang |
 |
| World Cup DH Round 4: Vallnord |
 |
| World Cup DH Round 5: Lenzerheide |
 |
| World Cup DH Round 6: Mont-Sainte-Anne |
The actual position is not really discernible since what is emphasized here is the change of ranking, i.e. the change of color. Note how roughly the top 5 riders consistently stay on top (consistently blue shades). In the top 10–20, it looks like a bad Split 1 can still be compensated in the race. Riders like Jack Moir or Mark Wallace seem to need some time to get into the race as their position at split 1 is often much worse than their final position.
The right part of the panels show the time differences relative to the smoking time. The scales for all races are identical. Note big time differences of almost 20 seconds in the top 20 rankings for the long races such as Fort William while the time differences are below 10 seconds for short tracks like Lenzerheide. Surprising, however, is that for the second longest track, Mont-Sainte-Anne, the time differences of the top 20 are within seven seconds, less than for the much shorter track of Lenzerheide.
What is also interesting is the general convex shape of the bars in the vertical direction. The time differences do not increase with a constant, linear slope. The slope seems to be steeper for the top 5 racers than for the ranks 10 to 20. An exception to this observation is the first race in Lourdes which was slightly interfered by rain in the finals and threw off the strong contenders. Mont Sainte Anne shows quite a linear increase of time differences only after the top four riders. So it looks like the top five or so guys really have something special in the bag. But one would definitely need to examine a lot more races for a better statistics to substantially infer anything about the performance density at the top. However, this observation seems to be accounted for, since if you look at the points allocation system shown below, the riders at the top really are un proportionally rewarded with points for the overall ranking. The nonlinear gaps in awarded points reflect the typical gaps in race times.

Points Earned at Each Venue
So now, let’s look at the total points gained in each race by the top 20 riders. Shown here are bar charts of total points with separate contribution of qualification and finals distinguished by color.
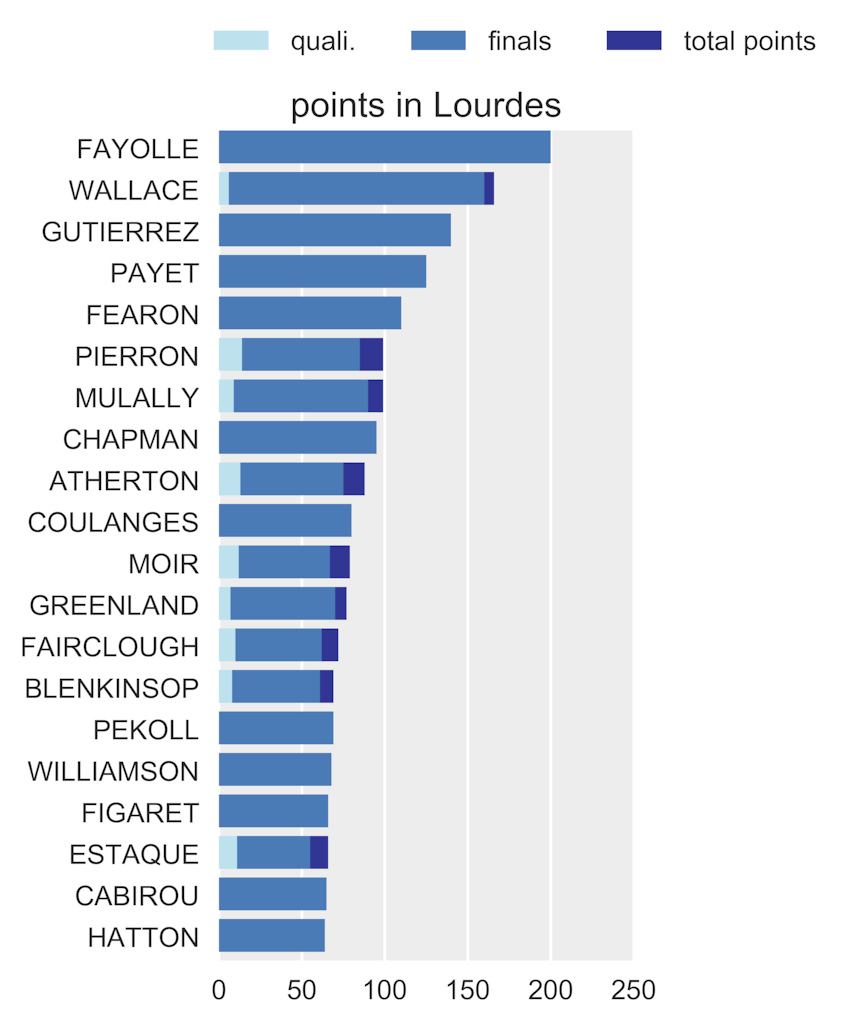
Points earned in Lourdes
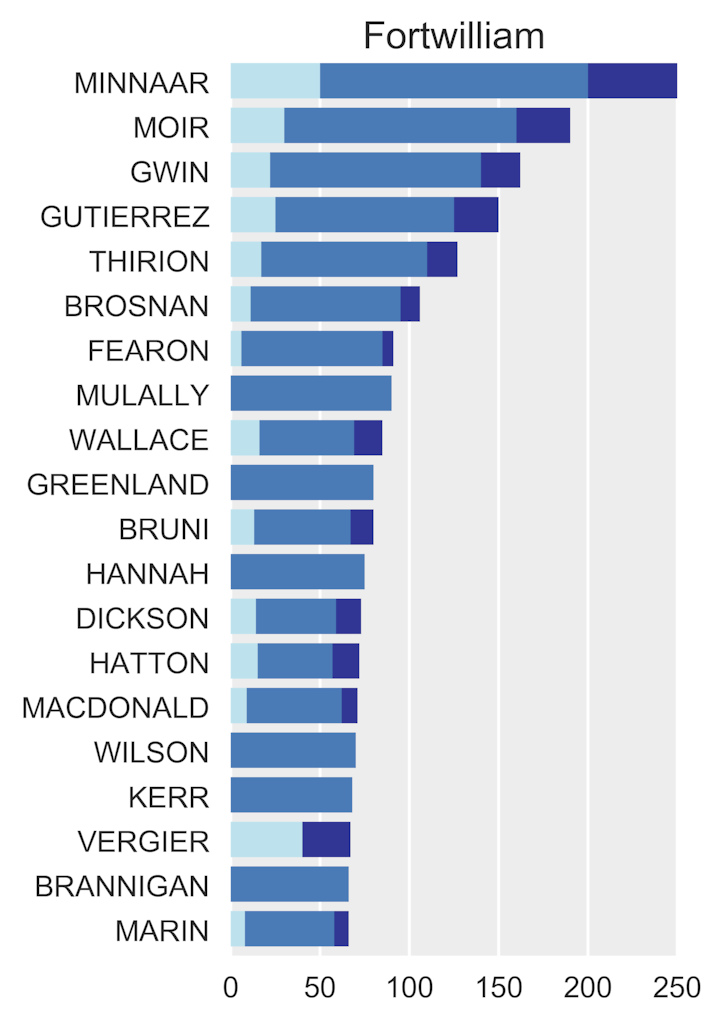
Points earned in Fort William
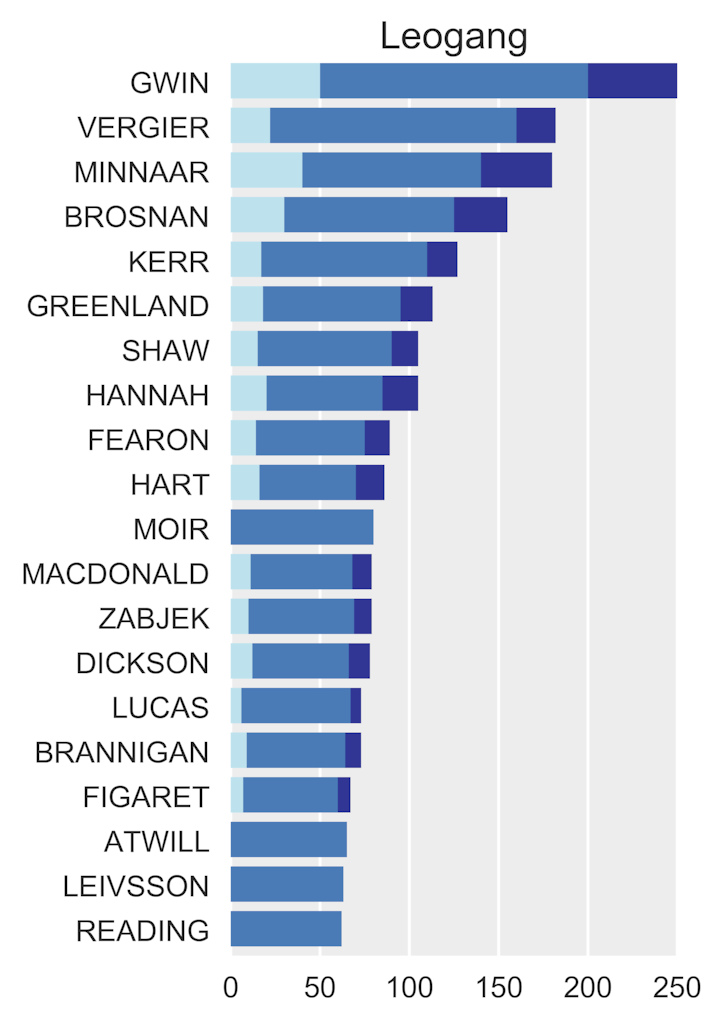
Points earned in Leogang

Points earned in Vallnord

Points earned in Lenzerheide

Points earned in Mont-Sainte-Anne
Note that in general, there is quite a good correlation between qualification and total points. The vertical ordering of bars is by total points, and the qualification points also generally increase with the final score. Some exceptions to this general observation are riders like Vergier (in Fort William) or Gwin (Lenzerheide).
The rain in Lourdes is identified by the fact that not many qualification points have been taken from the top 10 finishers. On the other hand, in Mont-Sainte-Anne, only the top seven finishers had points from qualification as well.
Points Accumulated Throughout the Season
Next look at how these points accumulated over the season. The respective bar charts show the cumulative sums of total points and contribution from qualification and finals after each race.
Minnaar clenched the first place in the overall after Fort William and hold onto the lead. But in Mont Sainte Anne, the gap has been closing down to less than 100 points between the top three riders to keep things exciting for the last race.
Considering the total of 250 points on the table in the final race and the fact that anything is possible in downhill racing, anything is still possible for the top three.

Point standings after Lourdes

Point standings after Fort William

Point standings after Leogang

Point standings after Vallnord

Point standings after Lenzerheide

Point standings after Mont-Sainte-Anne
Just looking at the separate contributions of qualifying and finals, see how Gwin, Minnaar, and Brosnan are all strong on both days of the race weekend. On the other hand, racers like Vergier or Shaw have been a little unlucky in the finals. The relative contribution of qualification points to their total is much higher than for example Moir, Wallace, Gutierrez or Lucas, who clinched more points come finals.
Finally, look at the season from each of the top 20 rider’s point of view.

There really is a consistency within the top 10. Guys like Hart, Bruni, and Lucas have been ramping it up slowly over the season. Wallace and Gutierrez, for example, have unfortunately been losing a bit of ground lately. Does this help anything towards a prediction for Val di Sole? Well, it’s downhill, so no prediction from past data, may the best racer of the day win on an equal track for everyone. In any case, the top three guys will have to battle it out and expect anyone from the top 20 to throw themselves into the mix.
Respect to all the racers, and bring it on once again this weekend!
MENTIONS: @axel-vertman
Author Info:

Must Read This Week
[UPDATED] Final Elite XC Results & Overall Standings from the Mairiporã XC World Cup 2024
41957 views
41957 views
Sign Up for the Pinkbike Newsletter - All the Biggest, Most Interesting Stories in your Inbox
PB Newsletter Signup
6/10
"What do you call a magic dog? -a Labracadabrador"
This has been working for me lately.