Stories posted under Pinkbike Community blogs are not edited, vetted, or approved by the Pinkbike editorial team. These are stories from Pinkbike users.
If a blog post is offensive or violates the Terms of Services, please report the blog to Community moderators.
How Much Are People Paying for Bikes? Introducing the Mountain Bike Price Index (MTBPI)

Anyone trying to buy a bike since March 2020 knows that new bikes have been in low supply. Many of us turned to the Pinkbike BuySell to find our next rides but were faced with prices that might embarrass even the likes of Santa Cruz and Yeti. But how bad is it? A Pinkbike article from June 2021 shows that new bike prices, when adjusted for inflation, have remain largely unchanged since 2011, but these new bike prices don’t reflect the reality for bikers facing the “Out of Stock” messages that have been burned into our retinas by now. Frustrated by this lack of information, I analyzed every Pinkbike BuySell post over the last six years to create the Mountain Bike Price Index (MTBPI) for the US and Canada.
Mountain Bike Price Index (MTBPI)
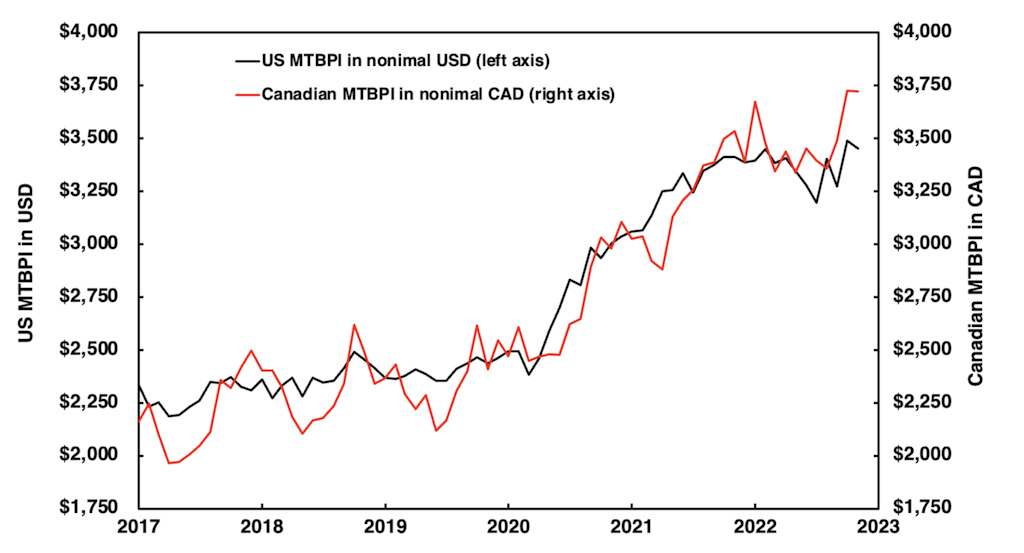
MTBPI for the US and Canada in "nonimal dollars"
The MTBPI calculates the average monthly price of all XC, trail, enduro, and downhill bikes listed as “Sold” on the BuySell. Clearly, the listed asking price won’t always reflect the purchase price, which we have no way of knowing. I know that someone in the comments is going to write about their buddy Wayne talking a guy down from $12,000 to $5,000 on brand-new, top-spec Yeti SB150. Nonetheless, asking price undeniably reflects market conditions. With that out of the way, it is interesting to note that the MTBPI was increasing steadily from June 2016 to March 2020 at a rate of about 3% per year. Canada also has notable seasonal variation, with prices reaching a low point each year around March or April. (Presumably, some Canadians begin to believe that winter is a permanent state and that they will never bike again.) Bikes in the US and Canada cost about the same in their respectively currencies, but this means that Canadian bikes actually were ~25% cheaper because $1.00 USD was worth about $1.30 CAD during this period. Prices increase sharply after March 2020, with peaks that are 45% to 55% higher.
Pandemic Surge of Interest in Mountain Biking
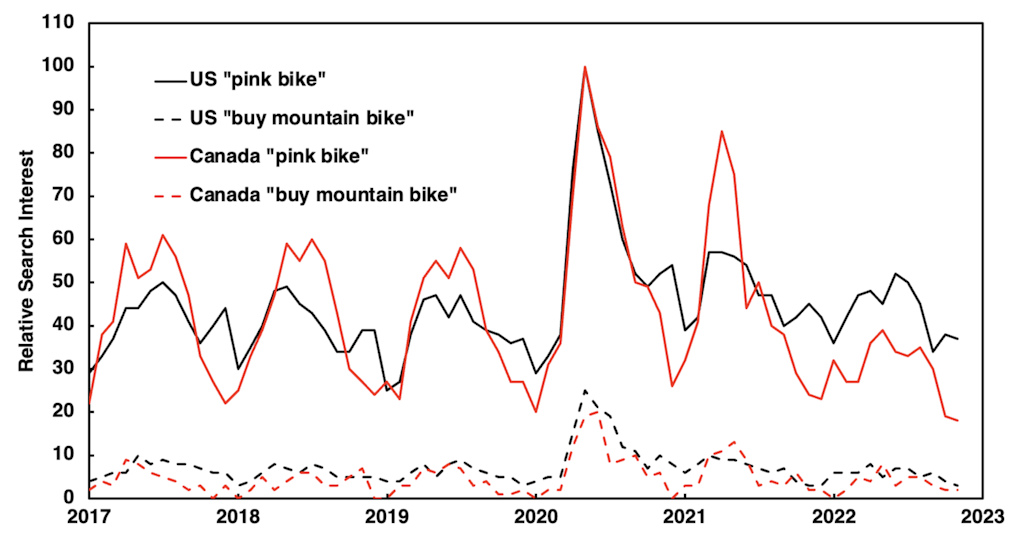
Google Search interest for the last six years
The steep increase in the MTBPI during the summer of 2020 correlates with Google Trends for “buy mountain bike” and “pink bike” search terms. Again, Canadians show a much more seasonal interest in mountain biking on account of their aforementioned dreadful, brutal, horrible winters. Since 2021, search interest has leveled off to pre-pandemic levels, but bike prices remain high.
MTBPI Adjusted for Inflation
Part of reason for these stubbornly high prices is that the MTBPI is calculated using “nominal dollars,” and no discussion of the MTBPI is complete without a discussion of the consumer price index (CPI). Inflation has been in the headlines a lot recently, but I’ll quickly define terms. Nominal dollars are how we generally interact with money. If I have an $1 bill from 1960, its nominal value in 2022 is still $1. “Real dollars” are how we adjust for inflation. The purchasing power of $1 in 1960 is about the same as $10 in 2022. In the US, the Bureau of Labor Statistics tracks such changes in purchasing power with the CPI. Therefore, we can use the CPI to adjust the MTBPI for inflation and look at prices relative to the purchasing power of the dollar (both USD and CAD) in October 2022. Adjusting for inflation is the generally accepted method for creating price indices. This makes the MTBPI akin to the inflation adjusted Case-Shiller U.S. National Home Price Index, which tells you that can’t afford to buy a house either.

MTBPI for the US and Canada in "real dollars"
Now we see that the MTBPI in real dollars was basically flat until March 2020, ignoring Canada’s large seasonal changes, and the pandemic peak was 30% to 40% higher. Current prices are still about 20% to 25% higher in the US than before the pandemic. Canadian prices remain near an all-time high but should see their usual wintertime drop soon. Therefore, it appears as though prices are actually trending slightly down lately. This is little comfort to me who, like many of you, hasn’t seen my pay keep up with inflation. But for those of you fortunate enough to see your pay increase fast enough, your dollars may soon go further in the bike market than they have since 2020.
Prices of New Bikes and the Depreciation of Your Bike
With these data, I can also track the price of a particular model year and predict depreciation. I use bikes from the US because it’s a larger sample, again with prices in real dollars from October 2022.
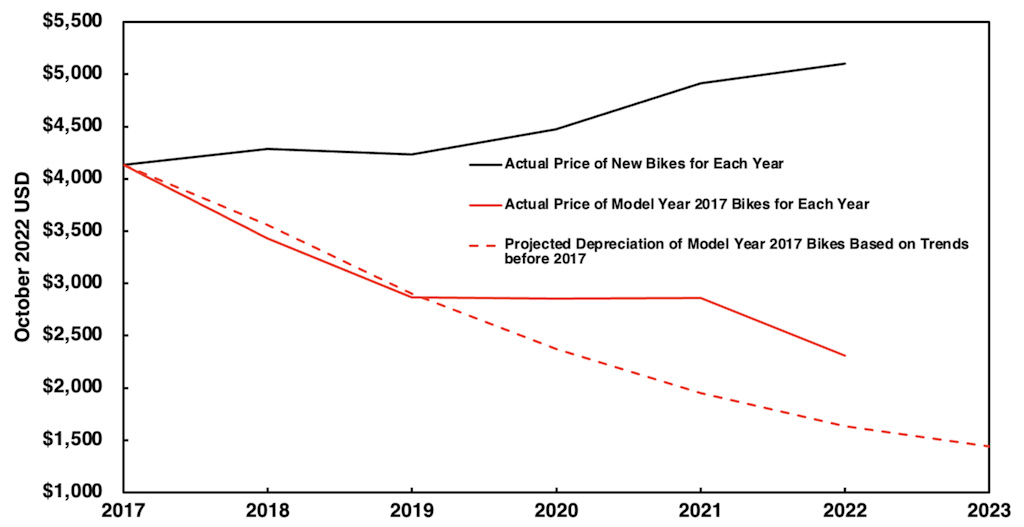
Price of "new" bikes and bikes from 2017
“New” bikes in this chart (solid black line) are bikes that were sold in their same model year (e.g., a 2020 model year bike sold in 2020), but I can’t distinguish between those that are truly new and those that were briefly ridden. New bike prices were stable before the pandemic at about $4,250. But they are more than 20% higher since then, even surpassing $5,000. To square this with the 2021 PinkBike article that found new bike prices to be relatively unchanged, I note that, while the MSRP of a particular new bike may not have changed, manufactures may have focused their production towards more expensive, higher-margin bikes during the pandemic, which would increase overall average prices. It's also possible that MSRPs were the same but that new bikes were earning a premium in secondary markets like the BuySell due to shortages.
But how much is your clapped-out bike from 2017 with a fork you never serviced and its original chain worth? In 2017, using the historical prices of older bikes, you could have made a projection about the depreciation of your bike (dashed red line). In the pre-pandemic era, the actual price of your bike (solid red line) would have been close to your projection, but in 2020 and 2021 your bike stopped losing value. Your bike was worth almost 50% more than its projected price in 2021! The 2022 price came back down a bit but is still about 40% higher than the projection. For those of you who became the proud owner a 2017 bike in 2021, you’re probably about to experience steep depreciation. If it’s any consolation, you still won’t be losing nearly as much value as someone who bought a new bike, and it was previously pointed out that rate of change in the mountain bike world has been slowing.
Takeaways
1. The Mountain Bike Price Index (MTBPI), based on the Pinkbike BuySell for the US and Canada, can be used to track mountain bike market conditions over time.
2. In nominal dollars, the MTBPI is still over 40% higher today than it was pre-pandemic. This persistent price increase can’t be fully explained by consumer interest, at least as measured by Google Trends data.
3. When adjusting for inflation (real dollars), the MTBPI peaks in 2020 and 2021 and then experiences a slight decline. But recent prices are still elevated.
4. New bike prices are still on the rise. Older bike prices are coming down.
This is just subset of the information I gathered. If there’s other data you’d like to see based on the Pinkbike BuySell, please drop it in the comments down below.
Author Info:

 Member since Sep 6, 2018
Must Read This Week
Sign Up for the Pinkbike Newsletter - All the Biggest, Most Interesting Stories in your Inbox
PB Newsletter Signup
I have so many questions of your data set! Component level breakdown would be fascinating. (If you had a data set of OEM builds you could see what people upgraded and to what.)