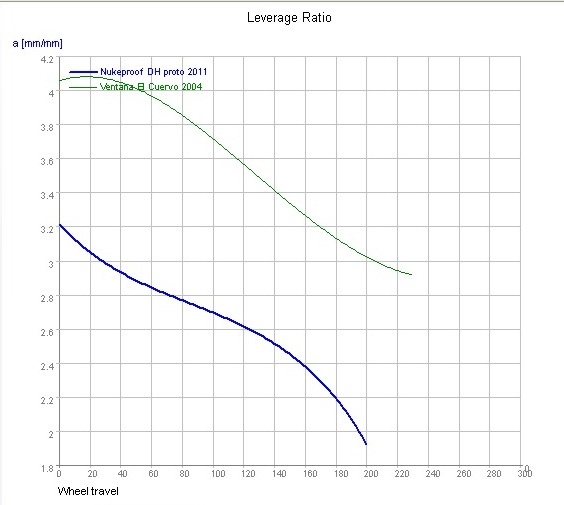
Nukeproof DH Proto rate curve.
1,760
Views
2
Comments
1
Fav
Photo info
- Album
- Press-Release-Images
- Category
- Parts - Suspension
- Date Posted
- Feb 17, 2010 at 13:00Feb 17, 2010
- Location
-
Chilliwack, British Columbia, Canada

- Trail
- none
- Riders
- none
- Articles
- New NukeProof DH Bike - First Peek
Photo details
Have I understood correctly?