Travel Feature
Eric hartley
Jun 20, 2024
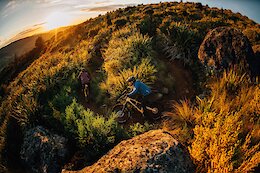
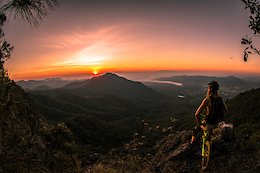
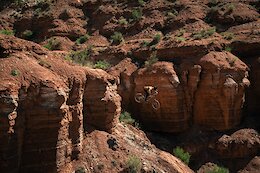 Photo Story: 'Slightly Above Below Average' with Steve Vanderhoek in Virgin, Utah
Getting comfortable on terrain that's just about as different from the PNW as it gets.
Travel Feature
Tory Powers
Oct 24, 2022
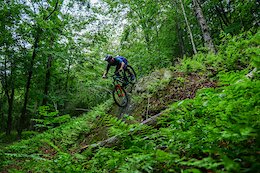
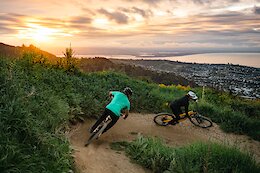
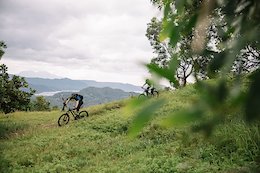
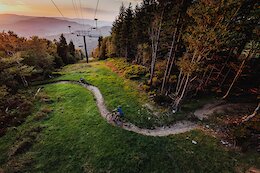 Destination Showcase: Pocahontas County, West Virginia
Pocahontas County has been hard at work for a number of years providing access for riders of all skill levels.
Featured Destinations
-
Layers w
- Map Content
- More Layers
- Pro
- Pro
- Pro
- Pro
- Pro
- Pro
- Pro
- Pro
-
Upgrade to

3D
Trail Conditions
- Unknown
- Snow Groomed
- Snow Packed
- Snow Covered
- Snow Cover Partial
- Freeze/thaw Cycle
- Icy
- Prevalent Mud
- Wet
- Variable
- Ideal
- Dry
- Very Dry
Trail Flow (Ridden Direction)
Trailforks scans users ridelogs to determine the most popular direction each trail is ridden. A good flowing trail network will have most trails flowing in a single direction according to their intension.
The colour categories are based on what percentage of riders are riding a trail in its intended direction.
The colour categories are based on what percentage of riders are riding a trail in its intended direction.
- > 96%
- > 90%
- > 80%
- > 70%
- > 50%
- < 50%
- bi-directional trail
- no data
Trail Last Ridden
Trailforks scans ridelogs to determine the last time a trail was ridden.
- < 2 days
- < 1 week
- < 2 weeks
- < 1 month
- < 6 months
- > 6 months
Trail Ridden Direction
The intended direction a trail should be ridden.
- Downhill Only
- Downhill Primary
- Both Directions
- Uphill Primary
- Uphill Only
- One Direction
Contribute Details
Colors indicate trail is missing specified detail.
- Description
- Photos
- Description & Photos
- Videos
Trail Popularity ?
Trailforks scans ridelogs to determine which trails are ridden the most in the last 9 months.
Trails are compared with nearby trails in the same city region with a possible 25 colour shades.
Think of this as a heatmap, more rides = more kinetic energy = warmer colors.
- most popular
- popular
- less popular
- not popular
ATV/ORV/OHV Filter
Max Vehicle Width
inches
US Cell Coverage
Legend

Radar Time
x
Activity Recordings
Trailforks users anonymized public ridelogs from the past 6 months.
- mountain biking recent
- mountain biking (>6 month)
- hiking (1 year)
- moto (1 year)
Activity Recordings
Trailforks users anonymized public skilogs from the past 12 months.
- Downhill Ski
- Backcountry Ski
- Nordic Ski
- Snowmobile
Winter Trails
Warning
A routing network for winter maps does not exist. Selecting trails using the winter trails layer has been disabled.
x
Missing Trails
Most Popular
Least Popular
Trails are colored based on popularity. The more popular a trail is, the more red. Less popular trails trend towards green.
Jump Magnitude Heatmap
Heatmap of where riders jump on trails. Zoom in to see individual jumps, click circles to view jump details.
Trails Deemphasized
Trails are shown in grey.
Only show trails with NO bikes.
Save the current map location and zoom level as your default home location whenever this page is loaded.
Save
Search By Region
Show articles for a specific travel destination, city, state or country.
Travel Tags
North America
Holly Duncan
May 7, 2024
 Trailforks Trail of the Month: Deliverance - Squamish, BC
This old-school steep and deep trail, recently got a new-school makeover.
Tory Powers
Mar 9, 2021
 Destination Showcase: McCall, Idaho [Updated for 2024]
Everything you need to know about riding in McCall, Idaho.
Brice Shirbach
Feb 23, 2021
 Local Flavours: The Complete Guide to Riding in Eastern Idaho [Updated for 2024]
There is a lot of incredible mountain biking to be done in the Pocatello area and in the Teton Valley.
Tory Powers
Mar 2, 2021
 Destination Showcase: Boise, Idaho [Updated for 2024]
Everything you need to know about riding in Boise, Idaho.
Brice Shirbach
Nov 2, 2023
 Video: Brice Shirbach Explores Charlemont, Massachusetts
Brice is back with another episode of 'Underexposed': a self-shot and produced series dedicated to showcasing trail advocacy and stewardship while exploring trails in unfamiliar places.
Europe
Jerome Clementz
Nov 20, 2023
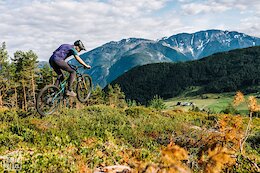
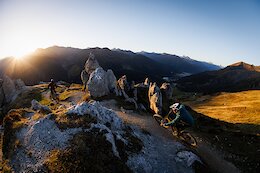 Photo Story: Trails and Views in Davos
Davos is a dream destination in the Swiss Alps with breathtaking landscapes and a huge variety of beautiful trails.
Pivot Cycles
Oct 24, 2023
 Video: Chasing Epic in Norway in 'Sight Unseen'
This season's Sight Unseen follows Pivot athlete Brice Shirbach as he discovers new trails and cultures in Norway.
Mark Matthews
May 27, 2023
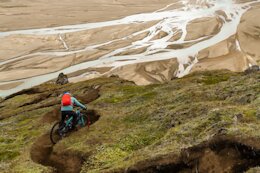 Video: Epic Landscapes in The Rise of Iceland’s MTB Scene
Despite facing significant challenges such as limited resources and environmental restrictions, these riders and trail builders continue to work tirelessly to create more mountain biking opportunities.
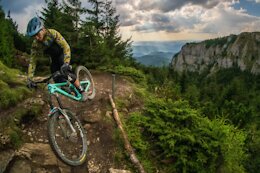 Photos: Roaming and Racing Across The Hills of Romania
After learning our EWS race didn't actually exist, we went exploring.
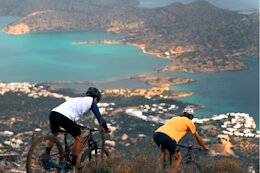 Exploring The Lesser Known Trails Of Crete: A Mountain Bike Journey
Loose rock and perfect views on this venture through the stunning and culturally rich island of Crete.
Australasia
Jesse Cseh
Feb 4, 2023
 Tour de Whakarewarewa: 230 Kilometers In 30 Hours For The Ultimate Sufferfest
Trailforks lays down the raw numbers at 315km of trail, with 13,000M total descent, and an estimated 30-45 hours of ride time.
Jay French
Jan 21, 2022
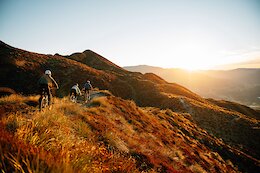 Destination Showcase: Queenstown, New Zealand
Situated on the northeastern shore of Lake Whakatipu, you'll find Queenstown, New Zealand's home of adventure.
Jay French
Jan 17, 2022
 Destination Showcase: Dunedin, New Zealand with Katy Winton & Joe Nation
Ōtepoti - Dunedin, is the southernmost of New Zealand's main centres. Here's everything you need to know before you head there.
Jay French
Jan 14, 2022
 Destination Showcase: Christchurch, New Zealand with Katy Winton & Joe Nation
Ōtautahi Christchurch in the heart of the South Island, is a perfect place to start your South Island riding road trip. Here's everything you need to know before you go.
Jay French
Jan 12, 2022
 Destination Showcase: Nelson, New Zealand with Katy Winton, Joe Nation & Rae Morrison
Nelson, or Whakatū, is the second oldest settled city in New Zealand. Here's everything you need to know before you head there.
Asia
MET Helmets
Mar 25, 2023
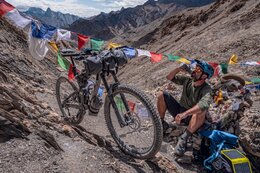 Photo Story: Exploring Ladakh In High Altitude Roaming
Cedric takes off exploring the Himalayan region on a bike at dizzying altitudes.
The Giros
Dec 21, 2018
 Video: The Ultimate Japanese Bike Trip in 'Chombo'
Road tripping, digging, partying and biking, in Japan.
Jan Feyser
Mar 21, 2018
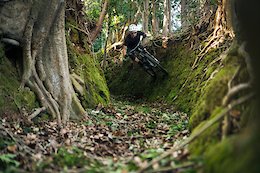
 Wild Winter Jungle Shredding & Good Times in Thailand - Video
Six months in Thailand building trails at Bike Park Chiang Mai, shredding bikes in the jungle, and nothing but good times.
Fuji Bikes
Mar 14, 2018
 Searching for the Elusive "Perfect Day" in Bali
Jimmy Smith heads to Bali on a trip that combines his two passions: biking and surfing.
Geoff Gulevich
Nov 18, 2016
 Land Of The Rising Fun - Gully and Deane Take on Japan
This October Geoff Gulevich and KC Deane headed over to Japan to experience the riding, the fall colours, and some unique cultural delights.