Stories posted under Pinkbike Community blogs are not edited, vetted, or approved by the Pinkbike editorial team. These are stories from Pinkbike users.
If a blog post is offensive or violates the Terms of Services, please report the blog to Community moderators.
Price vs. Weight Scatterplot - an interactive tool
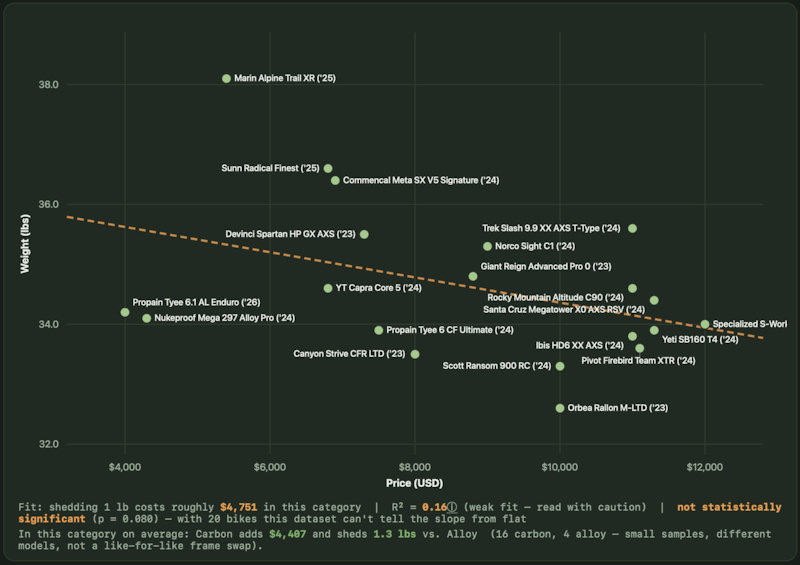
abc
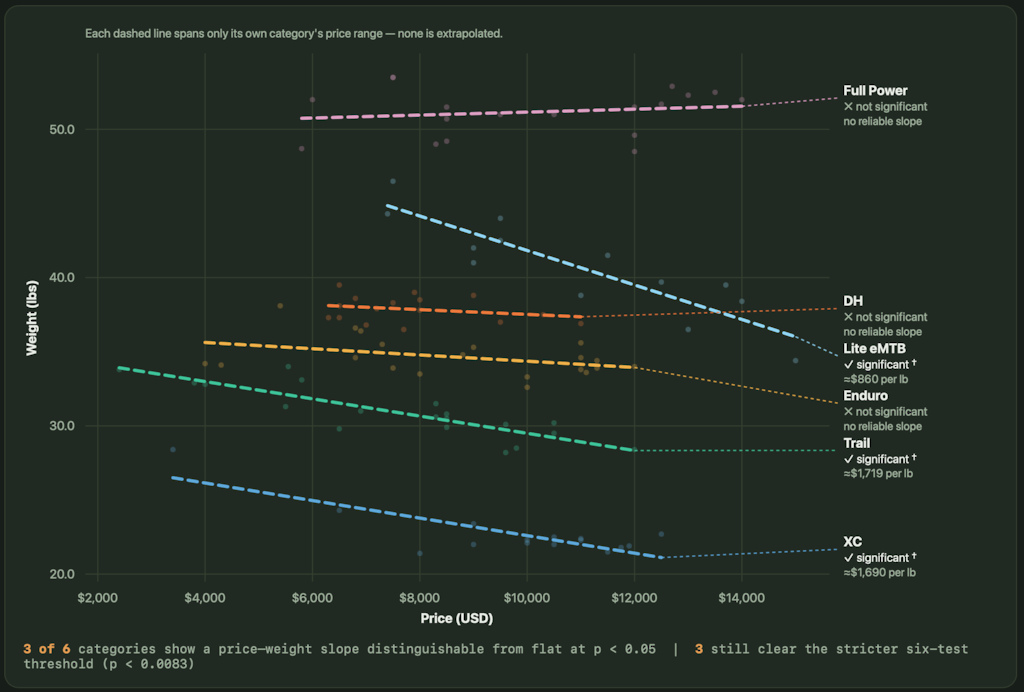
To enter your bike, adjust defaults, or compare carbon & alloy click here.
Thanks for reading
@redfoxrun
Castle Rock, CO
Author Info:

 Castle Rock, CO, United States
Steeper slopes and higher R2s in xc and trail relative to enduro and dh makes sense to me.
A great start! How do we add more data points?
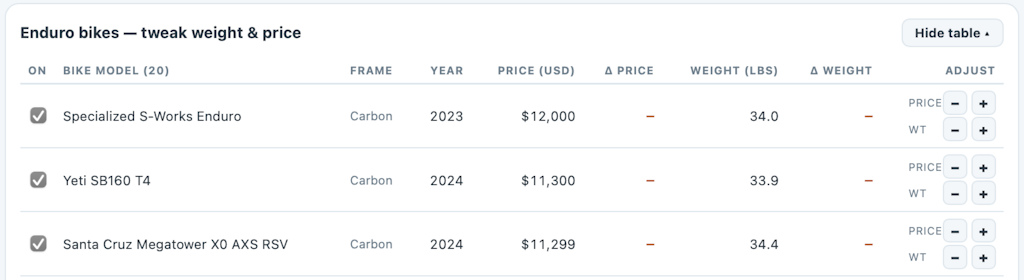
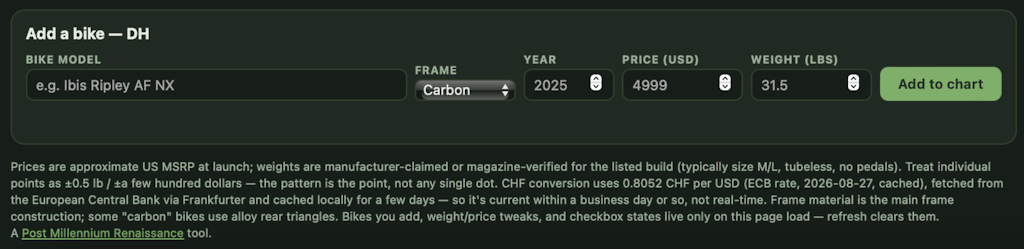
for data points you have two options:
"tweak weight & price (click "show table")
and
"Add a bike"