Nerding Out: Is World Cup Downhill Racing Getting Tighter?

Mar 15, 2019
by James Smurthwaite  
Laurie Greenland lunges to the line to finish the day 1.1 seconds back in 3rd.

bigquotesI think it’s as hard to get in the top ten now as it was to get on the podium when I first started racing.

A World Cup top ten rider said this to me off the cuff in an interview, and it makes sense. As the sport develops, the number of people racing increases, the talent pool widens and the top riders in the world should be closer in ability.

More than that, technology is also plateauing, fitness is increasing across the board and the rotating carousel of tracks are so well known it becomes harder to eke out advantages each year.

We now see far fewer outliers when it comes to winning times; the days of Sam Hill or Aaron Gwin putting 5+ seconds into the field are pretty much over. In fact, since 2015 there have been four races closer than the Beijing Olympics’ 100 meter sprint men’s final.

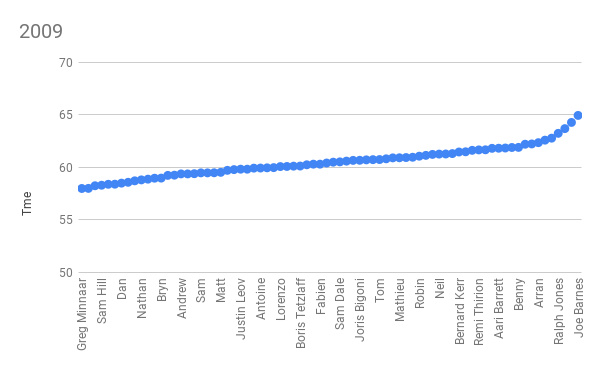
But just how close has it become? I set about gathering the numbers and testing the theory out. I started out simply working out what percentage of the winner’s race time you needed to be within to get in the top ten and the top five over the past 12 years of racing

photo
In 2008 you had to be within 4.5% of the fastest rider for a top ten finish, now it is around 2.7%
photo
For a podium, it was just under 3% in 2008 and now it has dropped below 2%.

In around 2008, being within three percent of the winner at a race on average would get you on the podium, now that just about gets you into the top ten.

So the racer was right? Maybe… but also maybe not.

There are so many variables in downhill racing that it makes such a simple comparison a bit useless. It was at this point I spoke to the World Cup’s resident statistician, Eliot Jackson, who jumped on board with the project and offered this to think about:

Full moto and with the roost flying Eliot Jackson had no trouble with the slick conditions to kick off the season with a spot on the podium.

“Is percentage is the best metric to use? Let's take a 1:00 piece of track - if that's true, then being three seconds back at the top of Fort William is the same as being three seconds back on the second sector of Val di Sole. This year the former would put you in 42nd and the latter would put you in 17th. Percentage doesn't take into account the difficulty of the track.

“If Windham is in one year that will skew times much tighter on a percentage basis than say a track like Val di Sole. Lourdes is insanely fast in the dry and unrideable in the wet, i.e. really close times and really not close times.”

So we decided to dig deeper.

Where can we fairly compare racers through the last few years of racing? What piece of race track is the same length every year, with the same features and is unaffected by the weather? The best answer we could come up with was the top section of Fort William.

Morning practice went off with about 20 meters of visibility and testing riders nerves as they had to head into high speed sections nearly blind.

It’s a section of track that lasts roughly one minute every year going from the start gate down to around the first rock garden. Rain doesn’t have a massive impact on this section of the track and, in fact, riders often say it rides better in the wet as it improves traction over the marbley surface. The start hut has been moved backwards a bit over the years, but for our money it was probably the closest we were going to get.

So what happens if we do the same test there?

photo
photo

Well, it's not the result we were expecting, that’s for sure. While the top ten results show a rough correlation towards being tighter, the top five results show the opposite and suggest it’s getting easier to be in the top five in this sector.


It’s interesting that most World Cup results sheets show the same pattern. A large clump of riders in the middle with outliers on either side. At the back of the race, riders drop off due to punctures, crashes, etc, and at the top, well, the level is just that much higher. This probably explains why those guys can command the big bucks.

Eliot graphed this for every World Cup round since 2000 and explains: "Each little line represents a race, with the y-axis being time. Just by looking at the graph a conclusion that one could make is that racers are getting faster, but to me, on a macro scale, this graph shows how the variance between tracks throughout the year has gone down and how tracks, on the whole, have gotten a tiny bit faster. The thing to look at here is the slope, or how steep, each of those little lines is. The steeper they are, the more time in between each racer. The flatter they are, the closer that race was. Just from a glance, they definitely seem to be getting a bit flatter, but one thing to note about that is that a lot of races are also shorter now, which means they will inevitably be closer. Super interesting to think/look at! See if you can pick out some of the famous mud races!"

photo

If we could measure the rough slope, that could be a better measure of the actual closeness of the race, rather than using a percentage. Eliot used this technique last year to predict winning race times and was able to get within 0.3 seconds, which boded well.

So, we went back to Fort William split 1 and did the exact same test. You can see the plots in the animation below, all following the same pattern Eliot described.

photo
0% Loaded prev 1/10 next


To remove outliers, we took out the top and bottom 20 from each year and measured the slope. Yet again, there wasn’t much of a correlation at all. If downhill racing is getting closer, the top section of Fort William isn’t where it’s happening.

photo

For fun we tried some other tests. To see if riders fitness had improved, we used the same test on the tracks Eliot thought were the most physically demanding each year. Again, there didn’t seem to be a massive pattern but it did show how much rain affects the physicality of a track. Cairns 2014 had a slope of 0.6, compared to the others that fell between 0.2 and 0.4.

We then played around with Val di Sole’s results. We both thought it was the most technically difficult track of the circuit and it had been on the calendar a good few years, so if rider skill generally was increasing then surely races there would become closer too?

photo

Trying it here did definitely show a trend but it’s hard to pin an entire theory on 8 data points. Some of these races were longer than others, two of them were World Championships, where a less capable field is racing, and riders will have naturally got more used to the track over the decade of racing here.

Yet again we were left empty handed with no real answers but this is the frustrating beauty of downhill. In baseball each team has 162 games in a roughly consistent pattern. Pulling stats and making theories with them is easy, not so much in downhill. Every race in downhill brings its own set of variables, challenges and curveballs. Is it harder now to get in the top ten than it was on the podium a few years ago? Maybe. Is downhill racing getting closer? Probably. Is every downhill race its own unique, exciting, unpredictable beast? Hell yeah! And that’s what makes it such a rad sport.


Think you've cracked the code? Create your own World Cup DH fantasy team now - racing begins April 27th in Slovenia.


Support Eliot and his stats website here.

Author Info:
jamessmurthwaite avatar

Member since Nov 14, 2018
1,770 articles

164 Comments
  • 184 15
 too much info, i looked at the first graph my brain started to hurt, so i watched the darkfest highlights again hmmmmm thats better haha
  • 9 38
flag tacklingdummy (Mar 15, 2019 at 12:49) (Below Threshold)
 Nobody read that entire article. Lol.
  • 4 1
 Connecting dots in Excel its got to science,!
  • 3 1
 @tacklingdummy: I'm a science professor, so I read it pi times.
  • 3 0
 @evolvo13: I guess I'm the only one that didn't read it. Lol. Yeah, I have a BS in Biological Sciences and worked in research before but didn't spend the time reading it. I spent my time reading the comments. Haha.
  • 2 0
 @dobermon: mmmmmm π
  • 60 3
 Looks like nobody works in Switzerland today.
  • 9 1
 im not
  • 3 1
 I'm working. Still..
  • 2 0
 Nope.
  • 10 0
 Working AND being on PB. What could possibly go wrong?....
  • 2 1
 I wasn't
  • 2 1
 wait a moment.......what?
  • 94 0
 Since I have all of you guys here, I seem to be having an issue with my watch I need some help with.
  • 14 1
 @ninjatarian: i was also looking for some cheese and chocolate suggestions
  • 18 0
 @ninjatarian: just send it over. We’ll take care of it, promised ????
  • 2 1
 @ninjatarian: This wins the interwebz for today!
  • 41 0
 I guess we need more races each season... For the data.
  • 3 1
 Exactly! They are sponsored by red bull, why do they need an off season!? Wink
  • 58 19
 I'd like to see the same figures for the women's field. Then we can have that pay gap discussion again...
  • 24 8
 What would you expect? What are you trying to say?
  • 12 4
 I would like to know what you mean too. As far as I can tell, this topic has nothong to do with pay?
  • 18 10
 @downhillnirvana: think deeper then. The number of externalities related to this fact is limitless. I believe Women should be paid as much as men, I do, for ideological reasons, if only to attract more women to the sport. But I understand the tendency and it is not some evil patriarchy bullsht
  • 6 1
 If you can't figure out what cvoc is saying then don't worry about it.
  • 23 13
 @WAKIdesigns: economics major here. If you think it is money that attract people to a sport your logic is far off. There is very little cash in the sport as a whole. The difference between making 50k to 70k will not support the argument of more women entering the feild. Money has very little impact in who competes in mountain biking.

Secondly, the best athletes should get paid the most. Not based on gender. I know of no females that have picked up mountain biking because of any pro female rider. If anyone on pinkbike has evidence to differ than I would appreciate seeing that. Having high representation in a feild male or female doesn't increase or decrease representation on either side, if it does you should look deep inside and find out what you really want to do and who you are. Because there are many males in engineering doesn't make me want to be an engineer, same as because there are many females in nursing doesn't make me believe I couldn't be a nurse if I wanted to be one.

Its mountain biking by the way dont bring politics on to pinkbike and spout about your ideology. Gtfo. Know one cares. Go ride your f**king bike.
  • 7 5
 @JmtbM: not sure about research in mountain biking specifically, but you can Google research on gender bias in career aspirations/choice.
  • 13 14
 @JmtbM: yes thank you for explaining my sentences. 1, 2 and 4. I understand why you focused on the third. You are a Petersonist shill! Now... as a major in Economics with above average understanding of human psychology and biology, you could identify one of Milton Friedmans four ways of spending money in my post (which is the favorite one of all the lefties) that is: spending someone elses money on someone else. It is so easy to motivate and virtue signal that it just rolls of my tongue/ keyboard. Somebody should do something... I lose nothing by advocating for even wages for women in sports. Nothing. Now... you are a sexist!

Know one cares - your funny Big Grin

Cheers!
  • 7 0
 Lol, y'all doing a lot of high pissing here.
  • 17 5
 @JmtbM: economics and math major who has been accepted to some of the top PhD programs in the world, who has published economics papers, and who does economic policy research for a living here.

You are thinking about this statically and without considering the central tenet of economics: people respond to incentives.

For many women, society tells them they are supposed to like dresses, not getting dirty, shopping, dancing, etc. from very young ages. They are incentivized to conform by their parents and other adults, and often do. Thus, their probability of riding bikes is low. As this turns into a stochastic process dynamically, the issue is perpetuated by the fact that little girls' fathers are more likely to mountain bike than their mothers and the girls are more likely to see men riding bikes than women in their environment and on television. (Something very similar has occurred in advanced STEM fields.)

From a labor and market perspective, biases have driven a reduced supply of qualified labor (female shredders), and a reduced market. With incentives of medium-term benefits, firms could provide full factory support for every qualified woman, therefore increasing the perceived likelihood of enjoying mountain biking among women, and increasing both the market and qualified rider supply going forward. Because of this potential and the low supply of female shredders, one could argue that female shredders have higher market value than male ones.

I should also point out that Tahnee, Rachel, and a local women's riding group got my wife into mountain biking. She talks every day about how much she loved riding bikes as a kid, and how frustrating it was to have her parents and other influential adults disincentivize that because it was "something boys do." She hates that it wasn't until her mid-20s that she rekindled one of her first loves.
  • 24 8
 @jcc0042: Wow! I guess the PhD in humility comes right after you finish composing your thesis in self righteousness?
  • 7 7
 I mean, do you sign off your emails like that, or introduce yourself in bars thusly? Or, is that extreme pressure flow of gratification reserved for chat? Just asking as an interested party.
  • 20 1
 @downhillnirvana: hahaha, no, it was a joking response to @JmtbM , who seemed to assume his undergraduate economics degree made him the foremost expert on the situation.
  • 2 2
 @jcc0042: haha, great to hear! Sorry man!
  • 2 0
 @downhillnirvana: no worries! The opportunity to read, "introduce yourself in bars thusly," made it all worth it, haha. Well done sir.
  • 6 20
flag WAKIdesigns (Mar 15, 2019 at 14:27) (Below Threshold)
 By getting PhD you have a paper confirming that you know scientific method. You can now do actual research. Congratulations. I hope you didn’t get blown by your Professor and the University so that you got chronic hemorrhoids, oh you have a Masters degree? Better than nothing when you run out of toilet paper. Competence is so rare...
  • 2 1
 @WAKIdesigns: lol what a mega burn!
  • 3 0
 In so far as I understand a PhD, it is a lot more than a piece of paper to state that you know any given method of enquiry. Etemologically, such qualifications are thesis based, because they are quite literally a Philosophical Diploma. Which means you have to conduct genuine, original research to gain the qualification. So, you see, you are required to conduct very specific research within your field during your Doctoral studies. For any given topic, what you refer to above is understood to be a Masters level qualification, Waki. 'Master of Arts' (MA) being one example; come on, the clue is in the name! Besides, a PhD can (in very many fields besides those which sit upon, as you say, "scientific method"), be based upon methods extra to the scientific. Competence is so rare...
  • 3 15
flag WAKIdesigns (Mar 15, 2019 at 15:13) (Below Threshold)
 @downhillnirvana: oh dear... titles are good for title minded. PhD, project leader, product manager, engineer, architect, art director, brand ambassador... Yet each one of them can piss only so high. I take smart ass please, because understatement takes me out of line of fire while the opposite, the dumb ass, is highly undesireable... that’s my philosophy. Offend and divide
  • 5 0
 @WAKIdesigns: did you not, before me, bring titles into the discussion? Were you ill informed? Experience leads me to belive so. I sit here a humble graduate, but I do not see any value in aspiring to learn from your two dimensional platitude. So, title or not, maybe you ought to pick up your pancil and draw a nice picture of a bike for us? Oh how they entertain me so.
  • 3 10
flag WAKIdesigns (Mar 15, 2019 at 15:32) (Below Threshold)
 @downhillnirvana: I refuse to accept your version of occured happenings. It was JmtbM who brought up a title of Major in Economics as if it guaranteed credibility among his kind. At least if he was a female I could be impressed, but he isn’t, his hormonal distribution makes him prone to guessing, modifying data, compensating lack of knowledge with confidence, not sticking to quality protocols.
  • 4 0
 @WAKIdesigns: you should probably feed your sketch books into the Flux Capacitor, to fuel it, and fire off at 88mph, back to 1989. A time when trolling was a concept understood to be playing with plastic toy trolls, with craxy hair. Fun times!
  • 1 0
 @JmtbM: so if athletes should be payed based on performance and not differentiated by gender, you're essentially saying women should never be paid the same as men at the top levels? That Rachel Atherton is undeserving of the same pay as Aaron Gwin because her times are 30 seconds slower than his? Women cannot be as strong as men at the top end of the spectrum, and cannot be as heavy as men at the top end of the performance spectrum. This puts women at a biological disadvantage to men in physical sport that relies on strength, stamina, and speed without aerodynamic assistance. The timing of the race also has little to do with entertainment value, or marketability of the athletes. It's all relative to the context. Also, your education is impressive and you should be proud, but that degree doesn't help in this conversation. The final say when it comes to pay cheques is advertising, sales, views and customers. The fact that women are getting the short end of the stick has less to do with performance and more to do with the views and opinions of sales reps and management at the big companies.
  • 5 1
 @KxPop: made no comment on the distribution of pay between men and women, I said the best should get paid the most. Man or woman. That being said fewer women compete.

May have not worded it the best but my point is:
That paying men or women more will not influence more people mainly women to compete. The opportunity cost of being an athlete is extremely high. Injuries, stress, sponsors, and so on. Therefore, few people will want to compete. Add to the fact the cost associated with competing.

I dont believe their is any evidence to support that idea that more female pro riders will influence more women to enter the sport.

Second point: fewer women compete. It would be nice to see more in competitions. I dont think money will influence them. I might be ignorant but I would believe they have other interests. To claim they want to compete or aren't allowed to or are forced out of the sport is a different discussion.

Saying women 50% and men 50% of money is just silly because men pull all of the sponsor dollars. Am I denying their good riders, not at all. Do they deserve a larger cut. I dont know. Maybe. But men should be making more because they have more influence and views.
  • 1 0
 @downhillnirvana: i bet the chicks dig it.
  • 2 1
 @JmtbM: Pay might be a factor for simply the reason it provides legibility. It might attract a few more woman and allow them to be seen. I teach in a pretty marginal field, art. I teach at a university that is minority majority and largely first generation, meaning these are the first people in their family (family being not just parents, grandparents, and siblings, but also cousins, second cousins, and nieces and nephews, aunts and uncles) to go to college. They are often literally the only people they know who are doing this college thing. Not only do they not have the same understanding of it as I did (both my parents have advanced degrees and I knew how it worked before I ever went, hell my dad is a professor, I hung out at universities since I was born), making it far, far, far harder for them, when I encounter them, they are taking classes in a field that is seen to have little relevance. All their friends, all their family are often telling them they are not only throwing their money away, but also not contributing to making the family stronger, making studying art a hostile act. These are crazy skilled people who are being torn apart. When I show them artists that are successful and who they see themselves in the feel armoured, inspired, prepared, in way that I will never be for them simply because our lives have been so different. Maybe that is not as it should be, but it is as they understand the world. To be able to identify with someone, to see yourself in them, and understand that that could be you, is very powerful. Being a cis-gendered white man, that has been my entire world. My students often feel as if they are told they can never do it because of who they are.

Pay, rightly or wrongly, is how we legitimize things. Girls seeing women treated more equally in MTB are far more likely to go into it as it is then a route that is open to them, not one where they are doomed to never be as good as their brothers and male friends. And once you open up that door, great things can happen. I know that the increase in diversity in my field has made the field far richer and more interesting than it was, even when I was an undergrad in art school.
  • 1 0
 @downhillnirvana: So high they seem to be getting it in their own mouths...
  • 2 0
 @pcmxa: I don't know any rider, male or female, that got into the sport due to racing. Everyone I ride with got into the sport through friends/family who suggested they try it, took them out on the trails, and encouraged them through their learning curve. Lots of my crew race, but they were riders first. A pro racer's salary would have zero impact on most recreational riders.
  • 2 0
 @WAKIdesigns: oops, accidentally upvoted you. Apologies to all.
  • 2 0
 @ColquhounerHooner: yeah, since I have the “industry” account I can see who props or downvotes, I saw your prop and I was like, wai’! da hoe neva’pvotes mae at
  • 1 0
 @WAKIdesigns, @JmtbM:

WAKI: Quoting Milton Friedman. Damn! I worked for a guy for several years who always called the Chinese Government "the Commie Bastards". His family escaped the mainland in 1950. Go figure.
Those 4 ways to spend money and Mrs. T's "other people's money" are my favorite political statements. From my time working on Government funded projects I might add "I'm from the Program Office and I'm here to help."

JmtbM:
I work with an engineer who has finished top 50 in some major marathons. He decided to stick with engineering because it is his belief that he would never make top 10, which you need to make a living at that game. In the past I worked with an engineer who switched from "Trumpet performance" to EE because he realized he would never sit first chair in a major symphony and second chair will never pay as well as being an engineer. Some people are motivated by money, but passion also makes a difference.

For all the SJWs: I tried to convince my younger daughter to go into engineering. She could have done it, no questions. She is in grad school studying to be a shrink. Fixing broken kids is what she wants to do. I bet she makes a big pile of money when she goes into practice. The other daughter went into S&M (sales and marketing for those who don't know what engineers call those folks), and was pretty good at it.

Then she and her husband had a kid and since they could live of what he makes she is staying home until he is a little older. Then she wants to go back to school and become a "special education" teacher, which will never pay as well as S&M. She doesn't care, and her husband makes enough for them to live well.

And finally, those folks getting paid well enough to live by riding a bicycle are paid out of the marketing budget. The prize money is probably a pittance compared to the endorsements. See the Rhino's comment on his deference to the caffeinated sugar water (energy drink) companies.
  • 1 0
 @Dangerous-Dan: Just remember that Milton Friedman was propelling an ideology and was blaming many general shortcomings of human individual and collective behavior on marxism which made him go over the edge on a dozen of occasions. When Noam Chomsky can pin you like a baby on something, using actual arguments and rough data, instead of usual condescending. generalizing humming, then it’s quite possibly wrong. In general no crktocosm to Milton, but the idea that “Free market” exists, is fantastic and greed will be punished by people voting with dollars, unless their actions are atopped by communistic regulations, is just ridiculous and ideological. Not to mention his insane ideas about privatizing public service, as IF he could not get on a plane come to virtually any Western European country and see health care being in a much better state than in US. A system he would call socialistic and over regulated.

So yeah, you cannot really fix all the holes by constantly mentioning statistics of Western vs Soviet countries as if West fully embraced capitalism and rejected Communism or at least Socialism dominating countries who do not succeed. As if the success of United States had nothing to do with unlimited access to vast natural resources, without any enemies to fight (as compared to Europe) as well as access to technology. And according to his vision of the world it was deregulation that led Western European countries to succession, as if it was not built on feudal system and conquest of less developed countries. And what did he have to say about China? China is a capitalist country disguised as a regime. Oh fk yes. Or maybe not. Or maybe all those capitalist or communist systems are disguised way how humans coexist.

TLDR.

As a former Catholic, and ex citizen of ex Eastern Block, I can smell Ideological BS from a mile
  • 30 3
 TL;DR

We don’t know
  • 25 2
 You could also (and I would) argue that the tracks have gotten easier and that is why the times are closer. Get back to technical and more challenging tracks and the times will spread out again.
  • 3 0
 The gist of the part that stood out to me. 'flatter tracks = tighter times...and overall, all in, the tracks are flatter'.
Now...is that intentional?(flatter tracks overall) Tighter times do generate more excitement...if the goal is to generate excitement and grow the viewership...Olympic contention??....which I would guess is the end goal of whoever benefits from the series(sponsors/organizations).
As much as we love to think it's about riders and/or the sport itself......it's about money. Always. follow. the. money.
  • 7 7
 ndaaa, it’s been said by several Redbull and UCI related officials, as well as team managers. Tracks are getting ironed to make for tighter race times. Sad? Yes, surprising? No
  • 2 0
 @WAKIdesigns: ...well there we have it. Following the money is solid science...all graphs lead to the money graph...hahaha
  • 1 5
flag nismo325 (Mar 15, 2019 at 12:01) (Below Threshold)
 I would argue you haven't watched enough WC DH these last couple years. Id say they have a good mix of bike park and tech tracks ATM. Also lets see some of the PB commenters ride the WC tracks and then tell me they are too irons out lol
  • 1 4
 @nismo325: it is rather obvious that the number of pinkbikers who can reach full tilt at motorways of Fort Bill or Leogang is limited. Sending these jumps at full tilt and I would not be surprised if number is below 20
  • 2 0
 @nismo325: This has zero to do with how many Weekend Warriors can ride at WC level...on ANY trail.
  • 5 0
 @WAKIdesigns: Sorry my friend...but your estimate of 20 is waaaaay low. There are 20 riders minimum just in Kamloops/Kelowna alone who can/will/do send absolutely anything you put in front of them Smile
Now...are those guys "pinkbikers"? maybe not per say...heehee
  • 3 0
 @WAKIdesigns: na, way more than 20. You got kids sending crabapple hits at Whistler these days, as big as anything on the WC. I remember riding the world cup track at Angelfire back when it stopped there (2005 I believe?) And thinking how easy it was (though angelfire does have steeper and better stuff). Overall in the WC, speed is the discriminator.

I firmly believe tracks need to be 2k vert minimum and DIFFICULT. Anyone that's ridden a trail like flying monkey in UT can confirm, if that kinda trail is raced, splits would be MUCH larger. Also would be nice to add like 4 more stops to keep the season going longer, and to showcase the outliers vs a bad run here or there. Not to mention all the mechanicals that plague the bikes...but that's a different convo.
  • 2 6
flag WAKIdesigns (Mar 15, 2019 at 12:34) (Below Threshold)
 @loopie: that is why I started with speed... there is a dramatic difference between sending Crabapple sized thing and survive, and taking same jump with too much speed. Clearing everything on Aline vs racing AirDH on it. In which case your pop timing must be near perfect in order to squash it properly, to not overshoot and lose speed/ avoid death. To the point of my point though, I cannot imagine a dude who can send such thing at speed come up here and throw sht at tracks, since such skill carries enough humility yo not do it. It is the folks who have no clue what they are looking at.
  • 2 0
 Yes, there is a clear distinction to be made between fast MTB'ers who send anything and BigBallzDirtJumpKidz who happen to be on MTB's....the kidz get dropped like stones when the real offroad trail cards get played.
Anyways...just sayin' don't underestimate the skills of quite a few Weekend Warriors ...especially in BC Smile
  • 2 0
 @Squeakybb: I picked up DH at the age of 45 (and MTB at 42) and only been riding a couple of full seasons. Now, I'm coming nowhere close to WC times, but I can ride all of World Cup at Angel Fire. If that is representative track from 2005, then my middle aged mediocrity tells me tracks are not getting easier at all and plenty of people can ride them. Way more than 20. I see guys (and by guys I am including some pretty awesome 12 year old girls) all the time that smoke me and hit way bigger stuff.
  • 1 0
 @loopie: hey, go easy on Waki, I'm sure he based his presumption on his personal abilities. He's only an architect after all.
  • 1 1
 @ColquhounerHooner: yeah, I am sure weeknd warriors all over the world send 30-40 footers at 25Mph for breakfast. Reminds me of good old times around 2008 when some folks on this site were claiming that 90% of trails in Whistler are XC. Back to today, Folks claim that a down country bike, or a long travel HT is the best choice for riding in Squamish! I am pretty sure I wouldn’t send the motorways from World Cup tracks as if it was nothing. But I can’t ride.
  • 1 0
 @ColquhounerHooner: Not going easy or hard...just friendly conversation Smile
  • 16 0
 Intersting, but the use of %age upsets my OCD
  • 9 0
 As much as poor spelling, interesting*
  • 2 0
 It made it difficult to focus on anything else ????
  • 1 0
 ?s were an accident...
  • 13 1
 When I read the thread title, I thought we were getting closer to watching a WC DH race. Gutted.....
  • 13 0
 Well, we are. Every day is one day closer. Don't worry.
  • 10 2
 A better approach is probably going to be to regress % gap on year dummies, controlling for total rainfall, average speed (will deal with the fast, non-technical races), soil type, soil type interacted with rainfall, and an indicator for whether rain started during the race. If you only used courses with multiple races held, you could swap some of those other controls with dummies for course.
  • 1 0
 Dont forget to control for track length. Or as you hinted at, restrict to multi year tracks, drop the track specific controls and use track fixed effects. Might run into problems due to lack of observations, though.
  • 2 0
 @Ttimer: yeah, you could certainly just throw the actual winning time in as a control for that, but a control for track length is only really necessary if we assume variations in fitness level. Using percentage gap naturally controls for track length otherwise. If we think fitness is relatively homogeneous, or that fitness is now orthogonal to skill among top riders, we shouldn't have to worry about track length.
  • 2 0
 We thought of that but then you would have to control for the elevation of the track affecting tire pressure and the riders ability to breathe Razz
  • 6 0
 @jamessmurthwaite:
Great article and I think it's very good to get some statistics presented on the start page from time to time. However, I have a few comments about your statistics. (Nerd talk on): Why not just display the gaps per race and the total gaps per year, as a box plot, and have the significance calculated. Depending on the distribution of the data, you have to proceed in different ways in order calculate the exact P-value (proof of hypothesis). Either at the end by Analysis of Variance (ANOVA) and Tukey-HSD-test or Kruskal Wallis Test and Man-Whitney-U as post-hoc-test. By adding environmental parameters, it would also be possible to analyse everything multivariate, e.g. by non-metric-multidimensional-scaling and environmental fitting. The whole thing can then be displayed nicely as a graphic with vectors as drivers. Then you really get an answer to the question whether the gaps are getting smaller, and if so what is responsible for it (change to 29, rain, wind, track length, changed track to last year etc.) I'm sorry, but a statistical analysis without P-values is not transparent for me, and not particularly scientific. I think you can get more out of the data than qantile-quantile-norm plots and regression-lines. (Nerd talk off)
  • 2 0
 got me thinking I'd love to see a github repo of the analysis. maybe it already exists and I haven't dug around enough yet, but certainly would follow and try to contribute. I'm just a data hobbyist but was actually just thinking last night about mtb datasources and potential visualizations - so funny to see this top of front page. (nerd talk on) my initial thought was 'i can't imagine the regression line being hugely significant given the amount of variance in the datapoints. but i could be totally misreading things, hmmm i wonder if there's a github repo'. (nerd talk off)
  • 1 0
 @CaptainBash: Wow I was going to say the exact same thing !
  • 4 1
 That's why we didn't provide P values Smile Because you can't make any conclusion based on the data. We have 179 data points. Even just using the variables you mentioned you are already overfitting. The box plots you're talking about with confidence intervals would be useless once you move to the next season because the tracks have changed, the riders have changed, the conditions have changed. You aren't measuring the same phenomenon, which means P values don't apply, or any conclusions for that matter.
  • 1 0
 @EliotJacksonBig Grin oes that mean you've already tried boxplots and p-values?
Maybe you would have to adjust the significance level for something like that. Normally it's p=0.05, maybe you'd have to find a lower level. And so we are again in the discussion that you have to think about what the definition of significance is.
I wrote the note fast last night without seeing the used dataset. That was only my consideration how I would go about it, also concerning representation.
During the night I tried to write a R-script myself. Unfortunately it already failed with the official UCI results to create the dataset. The calculation with the time format hh:mm:ss,000 has pissed me off too much.
  • 1 0
 @CaptainBash:

Yeah extracting the data from the PDFs is extremely annoying haha.

I understand what you are saying, and that would be totally valid if we were trying to answer the question of did the times got tighter. But we’re not. We’re trying to answer if it is more difficult to get a top 10 or not.

If we did an analysis and we said that from one season to the next the times get tighter by 1.3 seconds with a p valid of 0.04. That doesn’t tell us anything about it getting more difficult. If the tracks are all really difficult and the we go and race on a flat road, the times will all be within .5 all the way back to 50th place. Like I said, 1 second at one track is not equal to one second at another track. I.e making up 2 seconds at the top of fort William is waaaaaaay harder than making up 2 seconds at the second split at Val do sole.

The other thing that A simple averageing doesn’t take into account is that you’re not measuring the same phenomenon. It would be like doing an analysis on Olympic sprint times and measuring 100m one year and 50m the next.

It’s just a bit more complicated than it looks at first glance Smile .

I hate it when people use p values and statistical techniques to make an article look more scientific or credible when the assumptions they used for those test make the test invalid anyway. That’s why I didn’t do any of that.
  • 1 0
 @EliotJackson: Sounds understandable to me now. Maybe I'm to focused on these p-values, but that's how I learned proofing hypothesis.
Besides, I just wanted to spit a little nerd talks as I was totaly in writing R-scripts for my studies this afternoon.
Keep up the good work Eliot and James
  • 1 0
 @EliotJackson: using standardised scores (such as z scores) for performance measure (race time) would allow a comparison between any events, regardless of length, weather etc.,
  • 1 0
 @joel4: It does for sure! We just need enough data for those scores to be meaningful, which we don't really have Smile
  • 1 0
 @CaptainBash: Yeah, for sure! And that's the correct way! I was just saying that maybe we shouldn't even try to prove anything if it doesn't look like it would be correct. Just torturing the data at that point and we are really likely to overfit.
  • 9 0
 Open science : share your data and your scripts to let us deaw our own conclusions
  • 9 6
 Interprete graphs and be a dick about it
  • 2 1
 @WAKIdesigns: That is what makes the PB comments so funny. Most MTBers are Type A personality.
  • 5 0
 @WAKIdesigns: you don’t interprete a graph. The graphs just give you hints about the meaning of your data.
One needs statistics and a relevant theory to interprete data.
I think the article is quite nice. But still I would like it better if they provided a link to the raw data so that any theory can be tested against it...
Then be a dick about it would just be the icing on the cake...
  • 1 4
 @powpowpow: who sent you?!
  • 8 0
 Too bad Jake Phelps won't be around to not give FVCK about UCI DH again this season.

#RIPJAKEPHELPS
#PHELPER
#GOAT

I'm pretty amped about this season, however.
  • 8 1
 Of course it’s getting closer because time moves in one direction only. So yes, the start of the season is getting closer. Or was it a different question ? ????
  • 2 0
 Or time is another "dimension" and it is us that are unwittingly moving through time. I believe this has not been determined yet.
  • 2 6
flag WAKIdesigns (Mar 15, 2019 at 12:10) (Below Threshold)
 If you go in opposite direction of the two spinning supermassive blackholes just before their merger...
  • 7 0
 Can't wait for the 36ers to dominate this year!
  • 5 0
 Hellloooooo! Ask me anything haha. I'll try to give you answers on some of the conclusions and thoughts we had.
  • 5 0
 Also, PB comment section is a dangerous place to be.
  • 1 0
 @EliotJackson: I don't fully understand the stats, but i love reading them so mad props for that.

In your personal opinion (especially having spent so much time in places like Rotorua and Queenstown.) Whcih direction do you feel tracks should go in? More like GSD and World cup? or a different direction all together?

happy trails!
  • 4 0
 @dbc3: Thanks!

I think a lot of people like the World Cup, Grundy, Fundy, Rattatat lap. It think the thing that most riders want is places to separate themselves. Having things that other people can't do because there is a skill gap, instead of having things that you won't do because it is too risky.

Contrary to popular belief, taking a bunch of risk is not what makes you a great downhill racer. Smile
  • 1 0
 @EliotJackson: sort of like why having race track like thundergoat won't work. Because you can't do anything incredible to seperate yourself from the others?

I really appreciate the insight man. Hopefully I'll see you again in the gondola next year
  • 2 0
 @dbc3: For sure!
  • 1 0
 Do you think we would see an even tighter gap between the top 10 riders if there were a Waffle House next to the track on race day?
  • 2 0
 An interesting thing to look at would be to look at who the finishers are. If you have more variance in where riders finish in a season or two, then it would ideally help shed a little more light on whether or not the field is tighter.... I think..
  • 4 1
 Basically, you’d have to be a mad skilled unhinged nutcase then. You will still need to be that now, just with a proper diet and more training than before.

Which is all that’s really changed. Bar bikes are better.
  • 2 0
 You are looking at way to many variables based on the article title. Take the average separation of the top ten of all races over a season five years ago and the same for last season. Done. Or look at each of the last five seasons to average out weather, track length, and other variables from one season to the next. Don't forget what the original question was.
  • 2 0
 The original question is it getting harder. Not are the times getting tighter. If all the tracks are getting easier then the times will be closer but the difficulty of getting those times will be the same. You can't compare from season to season because, as you said, everything is different. Closer times =/= harder to get results. It's a lot easier to be within 3 seconds at the top of ft william than it is to be within 3 seconds in the second sector at val di sole.
  • 1 0
 @EliotJackson: I can’t tell whether it’s getting harder or they’re getting tighter, but times are usually short either way.
  • 2 0
 Should look at distribution of race times before going into this analysis. All this assumes normal distribution of race times, which is kind of the real question we are getting at. Eliot take a peak here: besjournals.onlinelibrary.wiley.com/doi/10.1111/j.2041-210X.2009.00001.x Would be cool to get some qqplots ripping for these to check normality. Ps thanks for the shuttle at moose.
  • 1 0
 Agreed! Need to do a sanity check on the data to determine if it is normal. Then, compare the standard deviations of race finishes over time to analyze on the spread is changing and if it is indeed "getting tighter". Then, to check if it's as difficult to get on the podium as it was to get in the top ten back in the day; I would probably look at how many standard deviations you would need to be from each respective sample mean to achieve that criteria. There is probably a more academic procedure to follow, but logically that would make sense to me.
  • 3 0
 The data isn't normal. There is a lot of heteroskedasticity. No worries!! Moose was sick!
  • 2 0
 @paulbrenneman:

The problem with that 1 standard deviation from 1 season does not equal 1 standard deviation from another. For that matter, they aren't the same from one day to the next or one track to the next.

Even if the data is normal, which it is not, there are too many variables to do something simple like that
  • 3 0
 Based on variance, sample size, and number of variables, I would say the the conclusion we can come to is that no statistically significant conclusion was derived from this...
  • 4 3
 This is interesting, but IMO with a fair bit of background in data analytics and statistics, your first calculation is the best and both show times getting closer. All of the others have far too few data points (just looking at Ft. William/VDS), or remove the times we are actually interested in by removing the winning times as outliers. Can you publish the P value of those regression lines, that would tell a lot more info, and I bet they are less than 0.1 which can usually be considered statistically significant in an initial analysis like this. Also, it would probably be helpful to control for the weather, type of track, and soil variables.
  • 3 2
 The analyses that you are criticizing are a crucial part of any complete analysis. It is valuable to look at each data point in isolation to see if anything interesting is happening. Of course, it is just an initial step. That's why the author concludes the article by saying there are a ton of variables and that the simple analysis presented here didn't result in anything conclusive.
  • 5 0
 @dfiler: Lol agreed, but they're also drawing conclusions on those single data sets saying, well maybe since fort william shows a positive trend it's not actually decreasing. As you say, you can't draw any solid conclusions on the data used, but I was saying I still think the first analysis is likely the most accurate, then gave suggestions as to what to improve.
  • 2 1
 Thanks for the reply!

I think you're missing the point of the article.

Any P-values we give will be worthless because of the amount of variance inherent in the sport. The regression lines probably should have been removed anyway as, as you say, there are too few data points.

Also, using percentage on anything time based with variance is actually the wrong way to go about it. The first graph is supposed to show an overview. As I alluded to later in the article. % doesn't take into account what tracks were in the season, the difficulty of those tracks, the weather, etc etc. So the first graph is actually the least accurate if you are trying to draw conclusions from the article, which shouldn't be done in the first place.

"Also, it would probably be helpful to control for the weather, type of track, and soil variables."
This is what we did by looking at the first split at ft william.
  • 1 0
 @EliotJackson: Hey man, you're absolutely right! Totally agreed with everything you said and I think my comment came off as more critical than I meant it, because as you say with the amount of variance in the sport it's really hard to do much meaningful statistical analysis. I just meant that I think you guys have a point when you determined that races were getting closer overall, even if not absolutely significant and that is probably the closest anyone would be able to get to an answer to the question.

Thanks for sharing, and ride on!
  • 1 0
 I'd like to see some data on mechanicals now versus 10 years ago. I feel like despite all the technology brought to bear on the sport, the massive amount of gram shaving tinkering still has the exact same effect on races it did in the old days, leaving us with the almost the exact same of top contenders losing a race due to "trying stuff". hah...
  • 1 0
 Tech levels havr more or less stabilised. Bikes are more or less equal now. Not like the mid nineties when I staryed with a totally rigid canti braked xc bike. With bikes being more capable the skillset needed to fully push them to the limits also increases. I see 15 year olds doing stuff now that we couldn't even conceive to be doable. The playing field has been leveled in many ways. Much of it from the tech that has come out of racing. For me the levelling began with some commercially available tech. Eg, tubeless tires, disc brakes, fox coil shocks and RS Boxxers. If you had this you were set equipmentwise in the noughties.
  • 3 1
 "The days of Sam Hill or Aaron Gwin putting 5+ seconds into the field are pretty much over."....that is until the next generation Hill or Gwin arrives and blows all our minds.
  • 1 0
 It’s always been the same I’m racing just in different ways, 90’s technology constantly improving and tracked going from running a 52tooth front chainring to a 36 tooth with tech sections, then 2000-2012 ish tech tracks fully reliant on rider skills then back to tracks that fitness is key, to current day where hopefully it’s a mixture of everything. Racing is racing!!! The fastest rider is the fastest, train hard and win.
Hopefully this year won’t be about marketing wheel size crap and back to the racing!!!!!!
  • 1 0
 Awesome bit of geekery @EliotJackson & @pinkbike.

Looks like the conclusion of this article got the answer nail on head; using finish time data alone cannot prove the "is racing tighter" hypothesis either way as the variables are well....too various!

As you've said elsewhere Eliot, Context is king. With out context the times can be somewhat meaningless or misleading. From my perspective as I have geeked over my own far more pinpointed data sets from the races for a good few years; the only questions we can ask of the data are very context specific ones. Correct me if you disagree though. For example maybe what we could ask "over the past 10 seasons", on race tracks with a winning time less than 3 minutes, when wet for all participants has the time gap between 1st and 10th changed, positive or negative. Sadly due to the low number of races this may not yield much. But if we included qualifying, which since the points rule change, is very much a "race" then we have double the data-sets.

Due to the variety of factors affecting performance maybe all we can hope for is answers to very specific hypothesis?

Interesting in the comments section and in the main article that "fitness" is seen solely as the resistance to fatigue. When in practice it is better to view it as "ability to meet/exceed the demands of the task", which of course does include resistance to fatigue, but not solely. Viewed like that maybe sector analysis like the fort Bill sector 1 analysis can have better meaning.

The context being that Sector 1 in Fort Bill has a short sprint which needs pedal "power" then those rapid change of direction berms that require fast rate of eccentric development in the lower body, from there you hit hose horrible long berms that you can't arch per se. This is where smooth patient cornering and no braking is key, from then on it's fast and precise onto the board walk section before you get to the rocks. Here the speed you carried from those corners is critical and your aerodynamic abilities are paramount. (clothing) - viewed like that then maybe the data makes sense. We cannot separate technique from fitness....ever! The one performance factor that has changed the most in the 10 years FB sector 1 has existed is the bikes. But that is probably the least critical factor here - With Aerodynamics here the key is frontal area - and as we all follow the same kit/clothing and helmet fashion trends then this too is negated as a factor, finally "fitness" which in this section can make a difference due to rate of eccentric force development, mobility abilities to "tuck" and power applied to the cranks for the first sprint. Again the lack of change in results over 10 years maybe means that fitness overall hasn't progressed?

Back then to context is king? No matter how hard you squeeze and torture data when the factors leading to winning are so varied context is all that matters? Both micro and macro context.. i.e. individual intrinsic factors and macro race track/weather/gradient factors and invariable the interaction between both micro and macro.

Personally think percentage analysis does have it's place at the individual level. But that's a chat for another day.


Thanks again for the public geeking!
  • 1 0
 Tracks have changed in that time, there are far less sections of differentiation these days and riders cant throw seeding to get the best weather too.
As you have used Linear regression, what is the Peasrsons Correlation coefficient ("r") for each of the results. Then the SD's of x and y.
Although the best fit line looks good and they trend down what is the calculated slope and intercept?

The top of Fort William to split 1 and the motorway is where the race is won and lost these days, the rest is predictable and there isn't really much to separate the riders any more since the rough portion of the track remains the same from day to day, run to run.

At Fort William I know for me (PB is only a 5.05 though), that the top and bottom berm and jump sections are worth up to 10s at race pace over a normal weekend ride, the middle is worth 1 to 2s max. Much up 2 turns up top and you lose 3 to 5s, dont pedal as hard as possible to the motorway and brake through hip replacement berm and you lose 4 to 5s! To me this is kinda pants for a Dh race, but it is what it is and its where the sport is now compared to 10 years ago where the woods was where it was won and lost at my level.
  • 1 0
 To much time on the computer and not enough time spent riding. There are way to many variables in downhill racing. Each rider has a peak to their career and their fitness level can change drastically from one year to the next. Sponsorships change and bikes change. Riders ride better on certain bikes and suspension designs. You can’t epect to get a clear graph
  • 1 1
 you guys really felt the need to make graphs? its pretty obvious to see. its pretty clear to see from the dual track pathways that they tuck and deathgrip down every race. Where did Maribor, champery, Bromont, Shladming, andorra go? all these tech tracks are gone and all of the venues that stayed just got wider and straighter.
  • 5 2
 I can't wait for snowshoe this year! It has me more excited for DH season than ever before!
  • 2 1
 More races, new tracks, and keep a few of the classic tracks....The goofy boy days are over, the new breed of competition is stronger and more professional...bring on the olympics.
  • 1 0
 Hopefully DH never will be on Olympics.Why??? We dont need that,we have world Champs!!!
  • 4 2
 There is 1 reason the races are closer now compared to 2008. Sam Hill isn't ripping the anus out of the UCI DH Circuit anymore.
  • 3 0
 In summary, go as fast as you can to win the race and be the worlds fastest racer-same mantra from the 90's. lol
  • 1 0
 The faster pros are generally faster. However, still dealing with humans and not robots. So any given day one pro can beat another pro. That is what makes racing so fun to watch because it is unpredictable.
  • 2 0
 the WC will just eventually turn into that new stupid ass skiing on a bike races they are introducing
  • 1 0
 Ah yes, skiing is lame! Way too many rad high-level Olympic disciplines, thousands and thousands of participants of all skill levels (despite having the equivalent of if the only place to ride MTB was a bike park) and a really solid development system for getting kids into racing... I agree very stupid ass! Also, a huge recreational base that doesn't race.

I agree the snow world cup isn't the type of riding that most of us can relate to. But maybe, just maybe, that's ok. I don't think either of us can relate to Joyride but I bet we both still think its f*cking rad. Let the sport grow.
  • 2 1
 Blue da ba dee da ba daa da ba dee da ba daa, da ba dee da ba daa, da ba dee da ba daa...all I think off when i saw these pics.
  • 2 1
 Maybe ask old hat racers (~5 years + on circuit) for their honest opinion on the trends to help validate. Quant + qual in harmony, baby babayyyyy.
  • 1 0
 More riding + (no math needed, please insert post ride beer here) = More fun, (cohesive universal theory)
  • 1 0
 I thought i was fast but they are on another level them pros lol love the stats
  • 2 0
 What on earth is %age? Those graphs tell me absolutely nothing.
  • 1 0
 "percentage"
  • 1 0
 I'm with the dude who bailed and watched DarkFest highlights over again- this has gotten all too heavy for me!
  • 2 0
 No racetracks are just getting smoother, along with the local trails.
  • 1 0
 World Cup race-tracks are not getting "smoother", that's an assumption that needs to be challenged when it's presented as fact. Andorra 2018 was a prime example of just how rough/eroded and weathered some of the repeat venue tracks are getting. Likewise the difference between larger amplitude "holes" and more frequent bumps that actually cause bigger issues with speed and vibration induced fatigue is a nuance that is hard to grasp from the videos/web-feed etc...
  • 1 0
 @davis10 MTB in general not just DH World Cup looks to me to have become more what we term ‘bike park’ over the years. More like MotoX or BMX it makes for better TV and looks more ‘fun’. Just look at jumps, years ago turn up to your local level DH race the track may have just a single built gap jump, jumping wasn’t a big part of it typically the track would be mostly be single track going down the steepest slope that could be found snaking between trees over roots and the time differences came about from sections almost being un-rideable, spectators could usually find a spot where only half the field would make it through without crashing. Speeds would often be very low, boring as hell to watch on tv but great fun to race. Tracks do tend to still have little bits like that but only little bits in between the ‘bike park’ straights or jump sections. They also don’t make it on to tv as look boring or hard to film.
  • 1 0
 @StevieJB: I'd agree regional and national events tend to have more man-made or bike-park type trails and sections, inevitable I suppose given the increase in those types of tracks and their sustainability. I remember the classic death defying sections well - tackled with v-brakes and bald tyres!! ;-)

I was just speaking specifically about the "smoothness" of World Cup tracks. They've not gotten smoother in the slightest. Due to repeat venues it's trending the opposite way. I've worked at every WC and World champs for the last 5 years, so I speak from first-hand experience.
  • 1 0
 Skip all the tech, if it was not getting tighter racing, it would not me interesting too watch?
Like Usain Bolt & 100m?
  • 1 0
 I don't understand why WC downhill races the same tracks over, and over, and over again.
  • 4 3
 Giddyup Motherfuckkers!!!
  • 2 1
 Introduce e-bikes and it will be as tight as in other motor sports Wink
  • 1 0
 It's getting closer, harder and now tighter.
  • 1 0
 Did you take the change of wheel size into account?
  • 1 0
 And are 29er really faster? Wink
  • 1 0
 Dh has always been tight, brah.
  • 1 0
 It's BIKE PARKIZED track every year
  • 1 0
 EliotJackson for RedBull TV! We need more geek stats!
  • 3 3
 Too many words and numbers:/
  • 1 0
 Nausea
Below threshold threads are hidden


Copyright © 2000 - 2024. Pinkbike.com. All rights reserved.
dv56 0.077704
Mobile Version of Website